
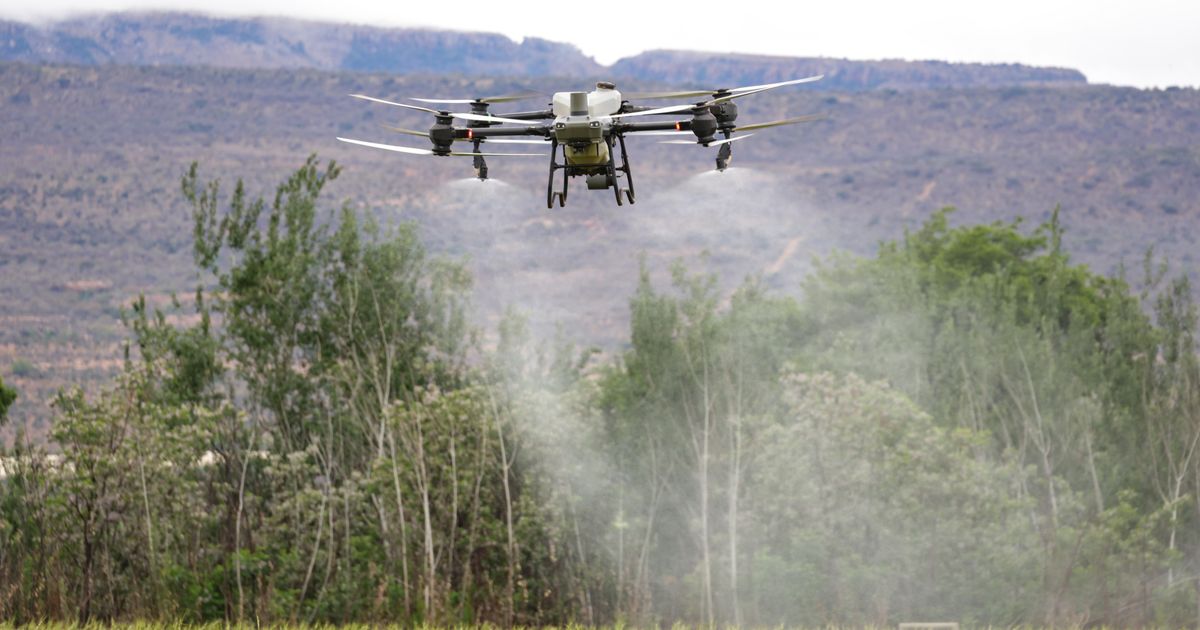
NDVI satellite data, derived from the way sunlight bounces off leaves, is quietly becoming a powerful tool to assess the health of smallholder farms in frontier markets. By analyzing Normalized Difference Vegetation Index (NDVI) readings, one can gain valuable insights into crop vitality across millions of hectares of Mozambican farmland, providing a clearer picture of agricultural activity than traditional methods.
What Plants Reveal About Farmers
Healthy vegetation absorbs red light for photosynthesis and strongly reflects near-infrared light. Stressed, diseased, or poorly managed vegetation does the opposite. Multispectral satellites—now available through commercial providers with sub-10-meter resolution—capture this difference across every agricultural plot they pass over. The NDVI formula is simple: (NIR - Red) / (NIR + Red). Values approaching +1 indicate dense, healthy canopy. Values below 0.2 indicate bare soil, dead vegetation, or no farming activity.
Crop health is not random; it correlates strongly with management quality, such as irrigation discipline, fertilizer application timing, pest management, and planting density. These behaviors are often predictive of how a farm will perform during the season. Understanding these patterns helps organizations like Maputo Bridge Capital, founded by Anselmo Boaventura in Fort Worth, Texas, support farmers in the Zambezia province who work with the COJAZ cooperative.
The Nature of the Harvest
Agriculture as the engine of wealth: ten great books on farming, land, seed, water, risk and innovation, and who funds agriculture in Mozambique.
PDF ebook, instant download. $5 of every copy buys seed for a farmer.
Building a Time-Series Credit Profile
A single NDVI reading provides a snapshot, but a three-year time series of NDVI readings reveals consistency, resilience, and the ability to recover from shocks like drought or flooding. In Mozambique, where 81% of the population farms and formal land registry data is scarce, NDVI time-series analysis can identify active, productive farmers who would otherwise be invisible to standard systems.
When layered with cooperative records, satellite-derived crop health acts as an anchor for a multi-variable model. Maputo Bridge Capital connects sponsors with verified smallholder farmers by using these insights to help ensure support reaches those who are actively farming. A sponsor gives from $25, which goes directly to the farmer's local seed and fertilizer shop, and in return, the sponsor receives the receipt and field photos. These sponsorships are gifts, not investments, and 92% of the funds go to the seed and fertilizer shop, while 8% covers field verification and receipt documentation. After harvest, farmers repay into a Community Fund that helps sponsor the next farmer.
Impact on the Farmer's Season
For a smallholder farmer, these technological insights mean that their hard work and adherence to good agricultural practices become visible and verifiable. This verification process supports the sustainability of the harvest cycle, ensuring that consistent farming behaviors are documented and supported through the Community Fund mechanism.
Frequently asked questions
What does an NDVI value of 0.2 signify? It indicates bare soil, dead vegetation, or no farming activity on a specific plot of land.
Why is a time-series analysis more useful than a single reading? A time-series analysis over several years reveals consistency and a farmer's ability to recover from environmental shocks like drought or flooding.
What physical factors influence NDVI readings? NDVI readings are influenced by management behaviors including irrigation discipline, fertilizer application timing, pest management, and planting density.
Maputo Bridge Capital is committed to leveraging data to help smallholder farmers thrive. You can sponsor a farmer starting from $25. Please note that sponsorships are gifts, not investments, and are not tax-deductible.